Lesson 1: FX Market Structure and Liquidity Map
Beginner LevelPublished: September 8, 2025
Lesson 1: FX Market Structure and Liquidity Map
Learning outcomes: Explain how FX pricing works, identify who moves price, map liquidity by session, and build a daily trade map.
FX is decentralized, so price discovery comes from banks and liquidity providers. This means spreads and volatility expand and contract based on who is active.
Your edge starts with time and location. If you trade during the right session at the right level, your signals will improve without changing any strategy.
Core concepts
- Base/quote logic and pip value basics.
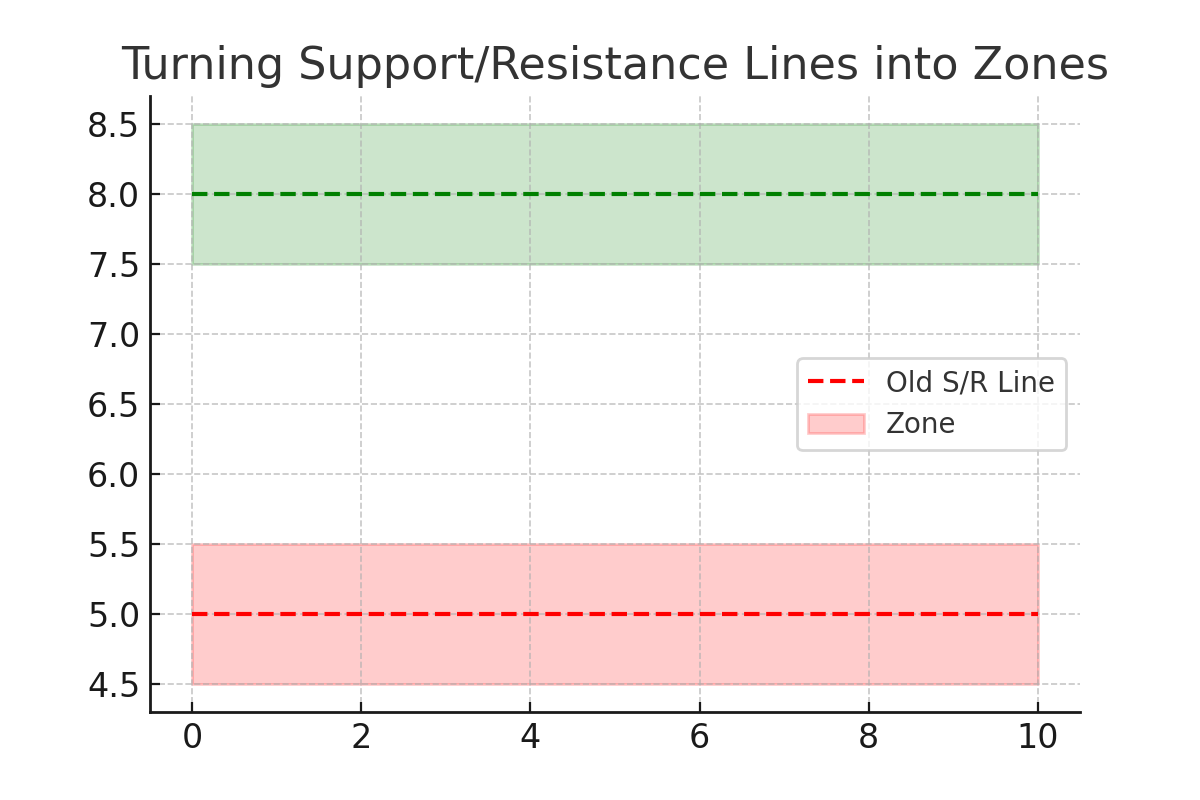
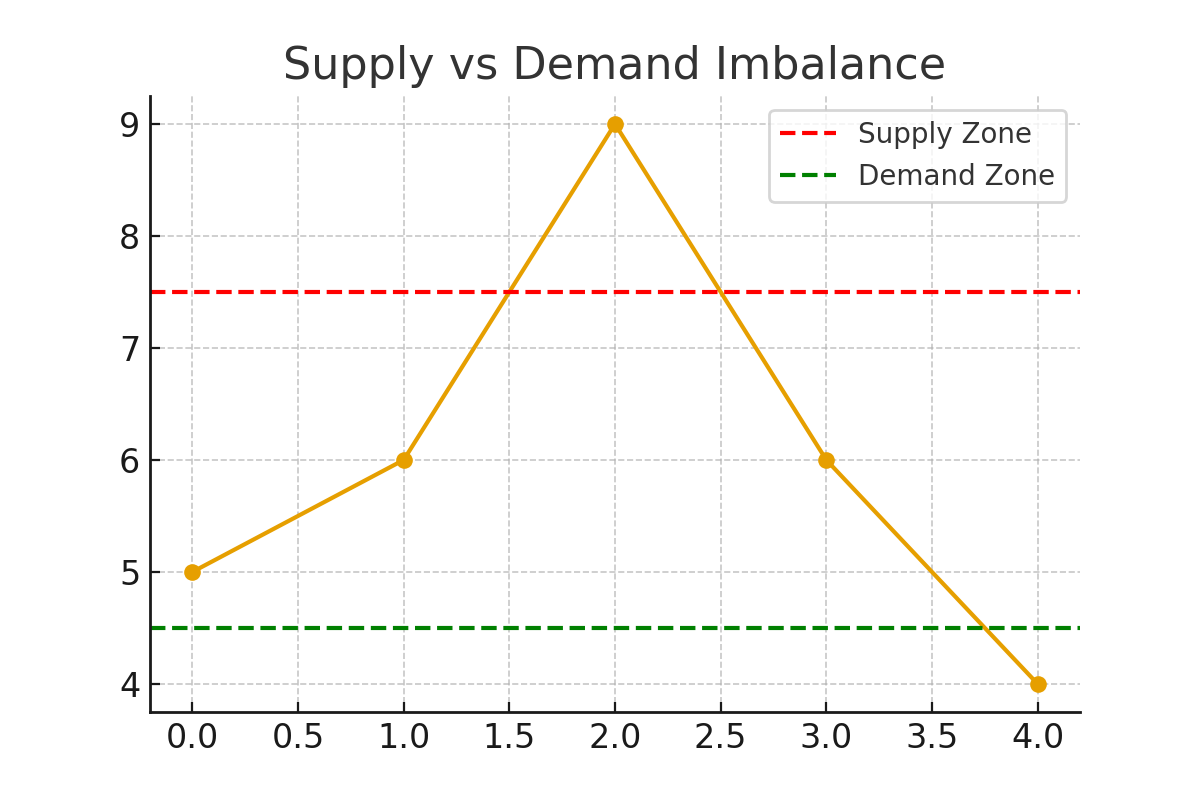
- Liquidity pools at prior highs/lows, session extremes, and round numbers.
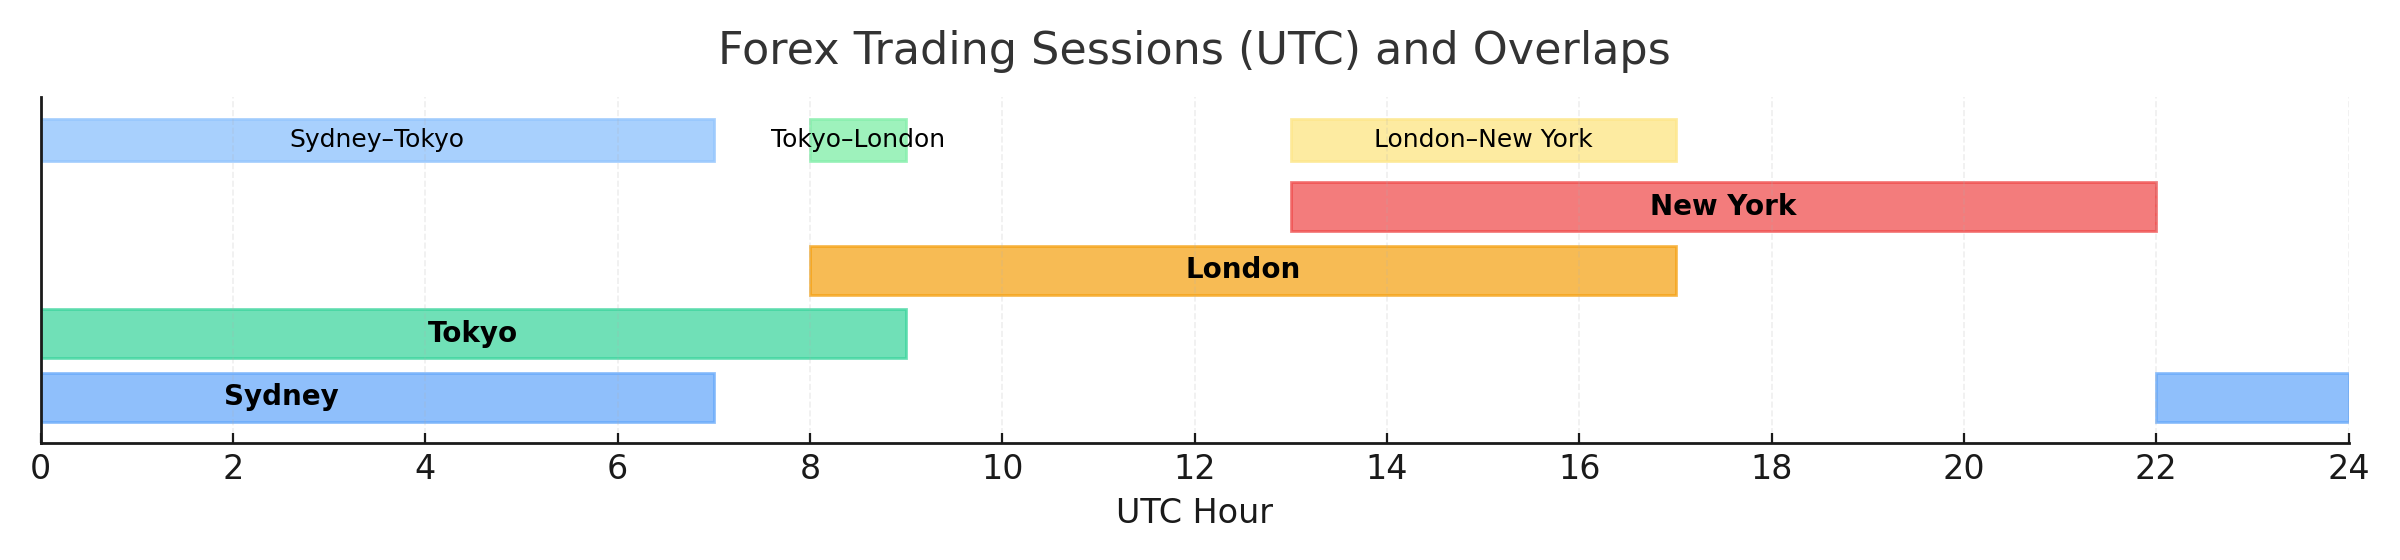
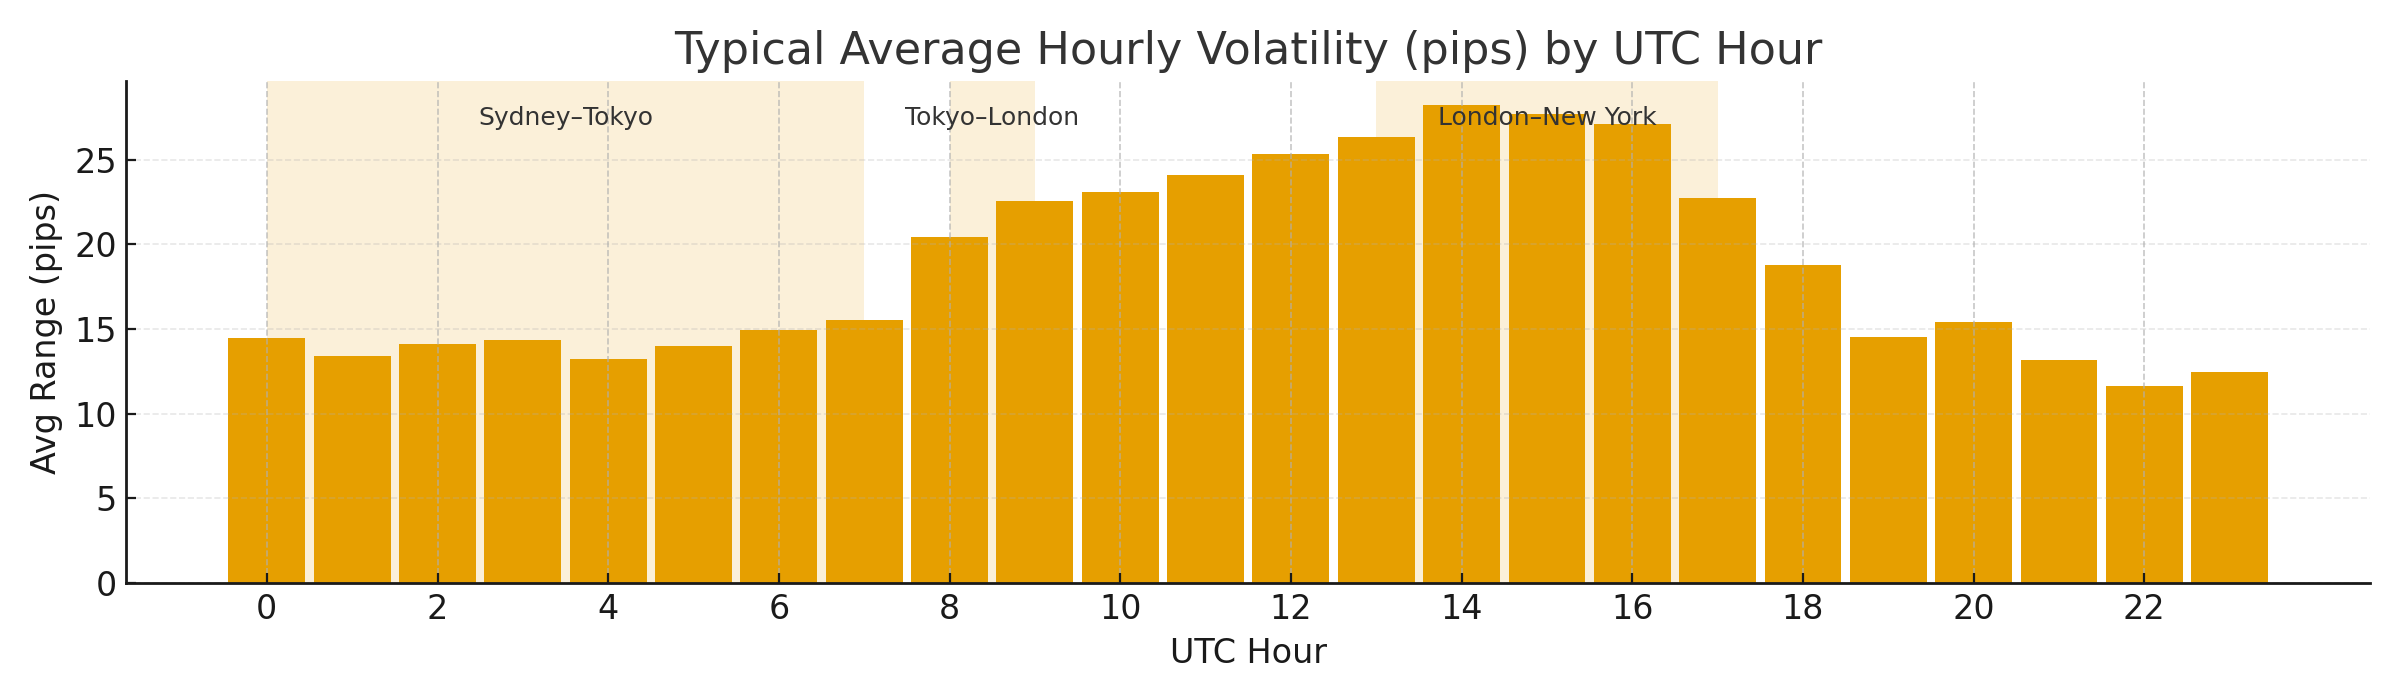
- Session flow: Asia ranges, London breaks, New York continuation or reversal.
- Spread behavior and why costs matter in low liquidity.
- Daily trade map: bias, levels, news, and timing.
Execution framework
- Set higher timeframe bias using H1 or H4 structure.
- Mark the prior day high/low and the Asia range.
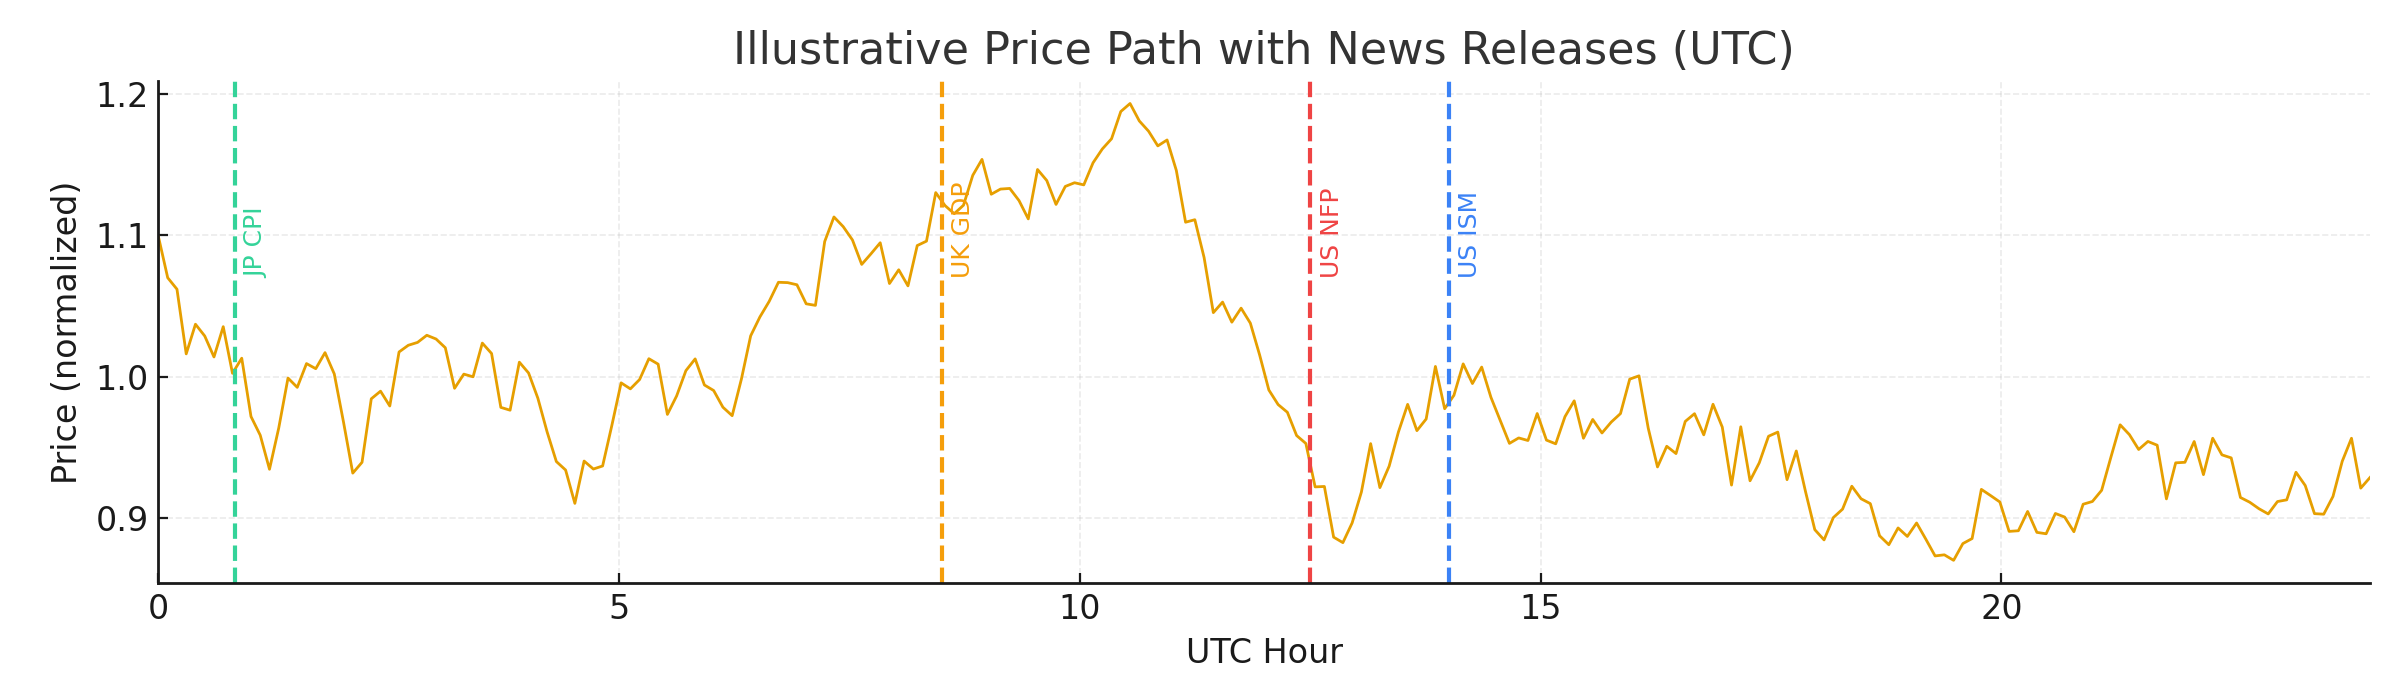
- Check the economic calendar for red news windows.
- Choose one session to trade and define your active window.
- Define max daily loss and a skip rule before the session starts.
Annotated walkthrough
Example: EURUSD during the London open. Use the Asia range as a liquidity box and plan the first decisive move.
- Box the Asia range and mark the prior day high/low.
- Wait for London to sweep one side of the range.
- Enter on a break and retest or a strong rejection close.
- Target the opposite side of the range or the next HTF level.
Common mistakes
- Trading low liquidity hours with tight stops.
- Ignoring spreads and slippage around news.
- Assuming every breakout is real without confirmation.
- Skipping the daily plan and chasing random moves.
Checklist
- Bias defined on H1 or H4.
- Key liquidity levels marked.
- Session window selected.
- News calendar checked.
- Spread normal for the pair.
- Max loss rule in place.
Practice drills
- Map Asia range and London break on one pair for 5 days.
- Track spreads at London and New York open for a week.
- Save 5 examples of liquidity sweeps and reversals.
Pro tips
- Trade the London and New York overlap for cleaner flow.
- Keep a simple level map, not 20 lines.
- Your timing matters more than your indicator.
Annotated Chart Pack
5+ annotated examples for this topic.
Download the lesson pack for offline study and practice.
Lesson Quiz
Pass mark: 80%